
Page 308 -
P. 308
13 Combining Mathematical and Simulation Approaches to Understand... 307
0.20
Empirical relative 50 000 simulation runs
frequency distribution Battery A
Error bars
Relative frequency 0.15 Exact
(std. error)
prob. function
0.10
0.05
75 80 85 90 95 100
Number of walkers in a house after 50 time-steps
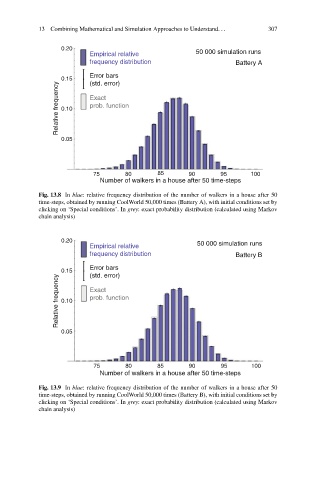
Fig. 13.8 In blue: relative frequency distribution of the number of walkers in a house after 50
time-steps, obtained by running CoolWorld 50,000 times (Battery A), with initial conditions set by
clicking on ‘Special conditions’. In grey: exact probability distribution (calculated using Markov
chain analysis)
0.20
Empirical relative 50 000 simulation runs
frequency distribution Battery B
Error bars
0.15 (std. error)
Relative frequency 0.10 Exact
prob. function
0.05
75 80 85 90 95 100
Number of walkers in a house after 50 time-steps
Fig. 13.9 In blue: relative frequency distribution of the number of walkers in a house after 50
time-steps, obtained by running CoolWorld 50,000 times (Battery B), with initial conditions set by
clicking on ‘Special conditions’. In grey: exact probability distribution (calculated using Markov
chain analysis)