
Page 311 -
P. 311
310 L.R Izquierdo et al.
P .X nC1 D jjX n D i/ D P .X n D jjX n–1 D i/ D p i;j
The crucial step in the process of representing a computer model as a time-
homogeneous Markov chain (THMC) consists in identifying an appropriate set of
state variables. A particular combination of specific values for these state variables
will define one particular state of the system. Thus, the challenge consists in
choosing the set of state variables in such a way that the computer model can be
represented as a THMC. In other words, the set of state variables must be such
that one can see the computer model as a transition matrix that unambiguously
determines the probability of going from any state to any other state.
13.7.1.1 Example: A Simple Random Walk
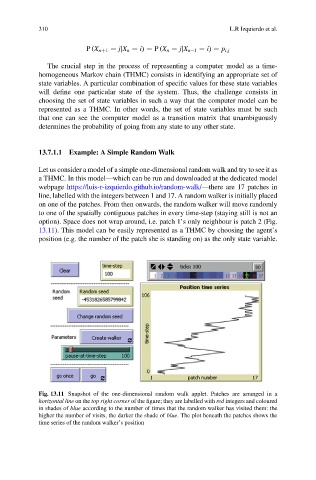
Let us consider a model of a simple one-dimensional random walk and try to see it as
a THMC. In this model—which can be run and downloaded at the dedicated model
webpage https://luis-r-izquierdo.github.io/random-walk/—there are 17 patches in
line, labelled with the integers between 1 and 17. A random walker is initially placed
on one of the patches. From then onwards, the random walker will move randomly
to one of the spatially contiguous patches in every time-step (staying still is not an
option). Space does not wrap around, i.e. patch 1’s only neighbour is patch 2 (Fig.
13.11). This model can be easily represented as a THMC by choosing the agent’s
position (e.g. the number of the patch she is standing on) as the only state variable.
Fig. 13.11 Snapshot of the one-dimensional random walk applet. Patches are arranged in a
horizontal line on the top right corner of the figure; they are labelled with red integers and coloured
in shades of blue according to the number of times that the random walker has visited them: the
higher the number of visits, the darker the shade of blue. The plot beneath the patches shows the
time series of the random walker’s position