
Page 38 - Six Sigma Demystified
P. 38
Chapter 1 d e p loy m e n t s t r at e g y 19
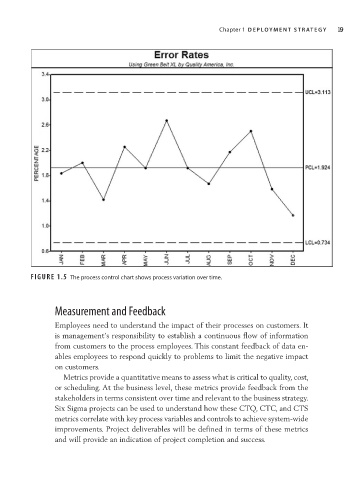
FIGURE 1.5 The process control chart shows process variation over time.
Measurement and Feedback
Employees need to understand the impact of their processes on customers. It
is management’s responsibility to establish a continuous flow of information
from customers to the process employees. This constant feedback of data en-
ables employees to respond quickly to problems to limit the negative impact
on customers.
Metrics provide a quantitative means to assess what is critical to quality, cost,
or scheduling. At the business level, these metrics provide feedback from the
stakeholders in terms consistent over time and relevant to the business strategy.
Six Sigma projects can be used to understand how these CTQ, CTC, and CTS
metrics correlate with key process variables and controls to achieve system- wide
improvements. Project deliverables will be defined in terms of these metrics
and will provide an indication of project completion and success.