
Page 37 - Six Sigma Demystified
P. 37
18 Six SigMa DemystifieD
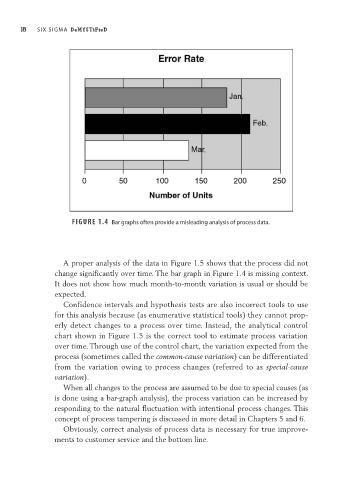
FIGURE 1.4 Bar graphs often provide a misleading analysis of process data.
A proper analysis of the data in Figure 1.5 shows that the process did not
change significantly over time. The bar graph in Figure 1.4 is missing context.
It does not show how much month- to- month variation is usual or should be
expected.
Confidence intervals and hypothesis tests are also incorrect tools to use
for this analysis because (as enumerative statistical tools) they cannot prop-
erly detect changes to a process over time. Instead, the analytical control
chart shown in Figure 1.5 is the correct tool to estimate process variation
over time. Through use of the control chart, the variation expected from the
process (sometimes called the common- cause variation) can be differentiated
from the variation owing to process changes (referred to as special- cause
variation).
When all changes to the process are assumed to be due to special causes (as
is done using a bar- graph analysis), the process variation can be increased by
responding to the natural fluctuation with intentional process changes. This
concept of process tampering is discussed in more detail in Chapters 5 and 6.
Obviously, correct analysis of process data is necessary for true improve-
ments to customer service and the bottom line.