
Page 386 - Six Sigma Demystified
P. 386
366 Six SigMa DemystifieD
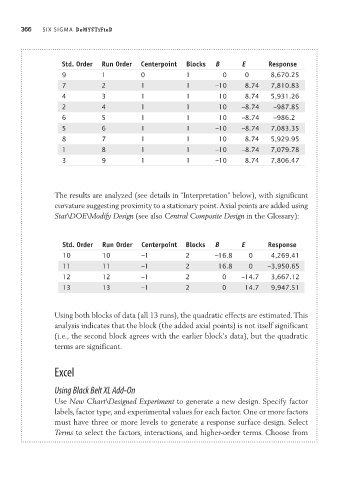
Std. Order Run Order Centerpoint Blocks B E Response
9 1 0 1 0 0 8,670.25
7 2 1 1 –10 8.74 7,810.83
4 3 1 1 10 8.74 5,931.26
2 4 1 1 10 –8.74 –987.85
6 5 1 1 10 –8.74 –986.2
5 6 1 1 –10 –8.74 7,083.35
8 7 1 1 10 8.74 5,929.95
1 8 1 1 –10 –8.74 7,079.78
3 9 1 1 –10 8.74 7,806.47
The results are analyzed (see details in “Interpretation” below), with significant
curvature suggesting proximity to a stationary point. Axial points are added using
Stat\DOE\Modify Design (see also Central Composite Design in the Glossary):
Std. Order Run Order Centerpoint Blocks B E Response
10 10 –1 2 –16.8 0 4,269.41
11 11 –1 2 16.8 0 –3,950.65
12 12 –1 2 0 –14.7 3,667.12
13 13 –1 2 0 14.7 9,947.51
Using both blocks of data (all 13 runs), the quadratic effects are estimated. This
analysis indicates that the block (the added axial points) is not itself significant
(i.e., the second block agrees with the earlier block’s data), but the quadratic
terms are significant.
Excel
Using Black Belt XL Add-On
Use New Chart\Designed Experiment to generate a new design. Specify factor
labels, factor type, and experimental values for each factor. One or more factors
must have three or more levels to generate a response surface design. Select
Terms to select the factors, interactions, and higher-order terms. Choose from