
Page 390 - Six Sigma Demystified
P. 390
370 Six SigMa DemystifieD
Methodology
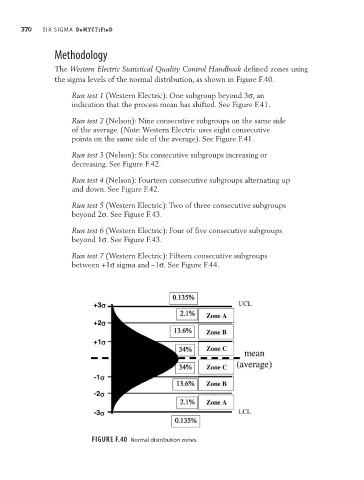
The Western Electric Statistical Quality Control Handbook defined zones using
the sigma levels of the normal distribution, as shown in Figure F.40.
Run test 1 (Western Electric): One subgroup beyond 3σ, an
indication that the process mean has shifted. See Figure F.41.
Run test 2 (Nelson): Nine consecutive subgroups on the same side
of the average. (Note: Western Electric uses eight consecutive
points on the same side of the average). See Figure F.41.
Run test 3 (Nelson): Six consecutive subgroups increasing or
decreasing. See Figure F.42.
Run test 4 (Nelson): Fourteen consecutive subgroups alternating up
and down. See Figure F.42.
Run test 5 (Western Electric): Two of three consecutive subgroups
beyond 2σ. See Figure F.43.
Run test 6 (Western Electric): Four of five consecutive subgroups
beyond 1σ. See Figure F.43.
Run test 7 (Western Electric): Fifteen consecutive subgroups
between +1σ sigma and –1σ. See Figure F.44.
Figure F.40 Normal distribution zones.