
Page 392 - Six Sigma Demystified
P. 392
372 Six SigMa DemystifieD
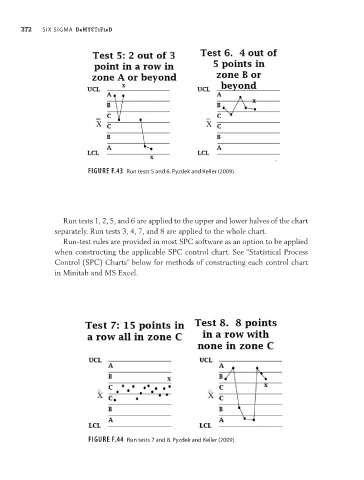
Figure F.43 Run tests 5 and 6. Pyzdek and Keller (2009).
Run tests 1, 2, 5, and 6 are applied to the upper and lower halves of the chart
separately. Run tests 3, 4, 7, and 8 are applied to the whole chart.
Run-test rules are provided in most SPC software as an option to be applied
when constructing the applicable SPC control chart. See “Statistical Process
Control (SPC) Charts” below for methods of constructing each control chart
in Minitab and MS Excel.
Figure F.44 Run tests 7 and 8. Pyzdek and Keller (2009).