
Page 394 - Six Sigma Demystified
P. 394
374 Six SigMa DemystifieD
Methodology
The x axis is used to measure the scale of one characteristic (called the indepen-
dent variable), and the y axis measures the second (called the dependent vari-
able). To collect data, independently change values in x, and observe values of
the y variable.
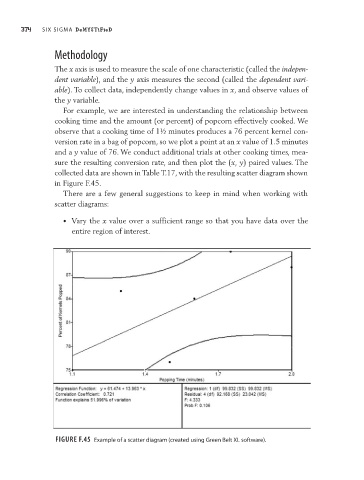
For example, we are interested in understanding the relationship between
cooking time and the amount (or percent) of popcorn effectively cooked. We
observe that a cooking time of 1½ minutes produces a 76 percent kernel con-
version rate in a bag of popcorn, so we plot a point at an x value of 1.5 minutes
and a y value of 76. We conduct additional trials at other cooking times, mea-
sure the resulting conversion rate, and then plot the (x, y) paired values. The
collected data are shown in Table T.17, with the resulting scatter diagram shown
in Figure F.45.
There are a few general suggestions to keep in mind when working with
scatter diagrams:
• Vary the x value over a sufficient range so that you have data over the
entire region of interest.
Figure F.45 Example of a scatter diagram (created using green Belt xL software).