
Page 399 - Six Sigma Demystified
P. 399
Part 3 S i x S i g m a To o l S 379
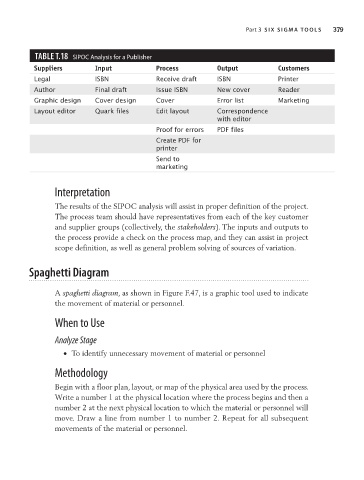
TAbLe T.18 SiPOC analysis for a Publisher
Suppliers Input Process Output Customers
Legal ISBN Receive draft ISBN Printer
Author Final draft Issue ISBN New cover Reader
Graphic design Cover design Cover Error list Marketing
Layout editor Quark files Edit layout Correspondence
with editor
Proof for errors PDF files
Create PDF for
printer
Send to
marketing
Interpretation
The results of the SIPOC analysis will assist in proper definition of the project.
The process team should have representatives from each of the key customer
and supplier groups (collectively, the stakeholders). The inputs and outputs to
the process provide a check on the process map, and they can assist in project
scope definition, as well as general problem solving of sources of variation.
Spaghetti Diagram
A spaghetti diagram, as shown in Figure F.47, is a graphic tool used to indicate
the movement of material or personnel.
When to Use
Analyze Stage
• To identify unnecessary movement of material or personnel
Methodology
Begin with a floor plan, layout, or map of the physical area used by the process.
Write a number 1 at the physical location where the process begins and then a
number 2 at the next physical location to which the material or personnel will
move. Draw a line from number 1 to number 2. Repeat for all subsequent
movements of the material or personnel.