
Page 397 - Six Sigma Demystified
P. 397
Part 3 S i x S i g m a To o l S 377
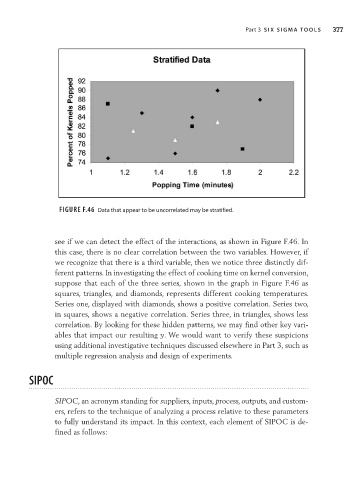
Figure F.46 Data that appear to be uncorrelated may be stratified.
see if we can detect the effect of the interactions, as shown in Figure F.46. In
this case, there is no clear correlation between the two variables. However, if
we recognize that there is a third variable, then we notice three distinctly dif-
ferent patterns. In investigating the effect of cooking time on kernel conversion,
suppose that each of the three series, shown in the graph in Figure F.46 as
squares, triangles, and diamonds, represents different cooking temperatures.
Series one, displayed with diamonds, shows a positive correlation. Series two,
in squares, shows a negative correlation. Series three, in triangles, shows less
correlation. By looking for these hidden patterns, we may find other key vari-
ables that impact our resulting y. We would want to verify these suspicions
using additional investigative techniques discussed elsewhere in Part 3, such as
multiple regression analysis and design of experiments.
SiPOC
SIPOC, an acronym standing for suppliers, inputs, process, outputs, and custom-
ers, refers to the technique of analyzing a process relative to these parameters
to fully understand its impact. In this context, each element of SIPOC is de-
fined as follows: