
Page 395 - Six Sigma Demystified
P. 395
Part 3 S i x S i g m a To o l S 375
• It is best to only work with data that are collected specifically for the
analysis. Other so-called happenstance data may include data that are
mixed over several populations. These separate populations may indi-
cate a hidden variable or interaction that is difficult to detect after the
fact.
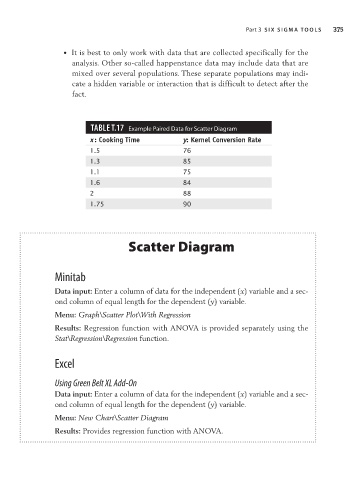
TAbLe T.17 Example Paired Data for Scatter Diagram
x : Cooking Time y: Kernel Conversion Rate
1.5 76
1.3 85
1.1 75
1.6 84
2 88
1.75 90
Scatter Diagram
Minitab
Data input: Enter a column of data for the independent (x) variable and a sec-
ond column of equal length for the dependent (y) variable.
Menu: Graph\Scatter Plot\With Regression
Results: Regression function with ANOVA is provided separately using the
Stat\Regression\Regression function.
Excel
Using Green Belt XL Add-On
Data input: Enter a column of data for the independent (x) variable and a sec-
ond column of equal length for the dependent (y) variable.
Menu: New Chart\Scatter Diagram
Results: Provides regression function with ANOVA.