
Page 402 - Six Sigma Demystified
P. 402
382 Six SigMa DemystifieD
A fundamental benefit of control charts is their ability to identify the com-
mon-cause operating level of the process. The region between the upper and
lower control limits defines the variation that is expected from the process
statistic. This is the variation owing to common causes—sources of variation
that contribute to all the process observations.
W. Edwards Deming demonstrated the principles behind SPC with his red
bead experiment, which he regularly conducted during his seminars. In this
experiment, he used a bucket of beads or marbles. Most of the beads were
white, but a small percentage (about 10 percent) of red beads were thoroughly
mixed with the white beads in the bucket. Students volunteered to be process
workers, who would dip a sample paddle into the bucket and produce a day’s
“production” of 50 beads for the White Bead Company. Other students would
volunteer to be inspectors, who counted the number of white beads in each
operator’s daily production. The white beads represented usable output that
could be sold to the White Bead Company’s customers, whereas the red beads
were scrap. These results then were reported to a manager, who invariably
would chastise operators for a high number of red beads. If the operator’s pro-
duction improved on the next sample, he or she was rewarded; if the produc-
tion of white beads went down, more chastising occurred.
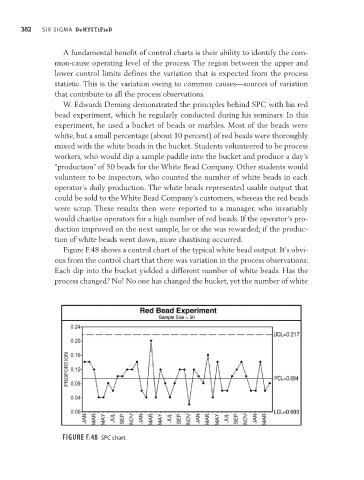
Figure F.48 shows a control chart of the typical white bead output. It’s obvi-
ous from the control chart that there was variation in the process observations:
Each dip into the bucket yielded a different number of white beads. Has the
process changed? No! No one has changed the bucket, yet the number of white
Figure F.48 SPC chart.