
Page 406 - Six Sigma Demystified
P. 406
386 Six SigMa DemystifieD
A rational subgroup has the following properties:
• The observations comprising the subgroup are independent. Two observa-
tions are independent if neither observation influences or results from the
other. When observations are dependent on one another, we say the process
has autocorrelation or serial correlation. (These terms mean the same thing.)
• The subgroups are formed from observations taken in a time-ordered se-
quence. In other words, subgroups cannot be constructed arbitrarily by
taking multiple samples, each equal to the subgroup size, from a set of
data (or a box of parts). Rather, the data comprising a subgroup must be
a “snapshot” of the process over a small window of time, and the order of
the subgroups would show how those snapshots vary in time (like a
movie). The size of the “small window of time” is determined on an indi-
vidual process basis to minimize the chance of a special cause occurring
in the subgroup (which, if persistent, would provide the situation de-
scribed immediately below).
• The observations within a subgroup are from a single, stable process. If
subgroups contain the elements of multiple process streams, or if other
special causes occur frequently within subgroups, then the within-sub-
group variation will be large relative to the between-subgroup variation
averages. This large within-subgroup variation forces the control limits to
be too far apart, resulting in a lack of sensitivity to process shifts.
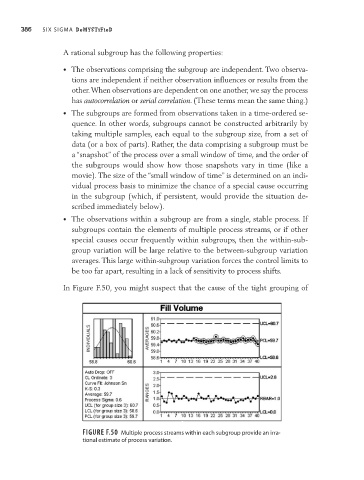
In Figure F.50, you might suspect that the cause of the tight grouping of
Figure F.50 Multiple process streams within each subgroup provide an irra-
tional estimate of process variation.