
Page 411 - Six Sigma Demystified
P. 411
Part 3 S i x S i g m a To o l S 391
Although subgroups of size 1 provide some estimate of the process location,
we sometimes choose to collect data in larger subgroups because we obtain a
better estimate of both the process location and the short-term variation at that
point in time.
Control charts available for variables data include
• Individual-X charts (also known as individuals charts, I charts, and IMR
charts): Used for subgroup size equal to 1.
–
• X charts: Used for subgroup size 2 and larger.
• EWMA (exponentially weighted moving average) charts: Used for subgroups
of size 1 or larger. Suitable for nonnormal data or increased sensitivity to
small process shifts.
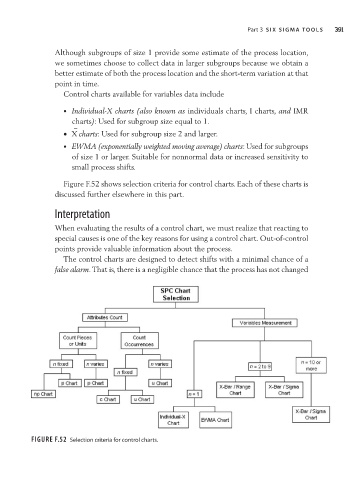
Figure F.52 shows selection criteria for control charts. Each of these charts is
discussed further elsewhere in this part.
Interpretation
When evaluating the results of a control chart, we must realize that reacting to
special causes is one of the key reasons for using a control chart. Out-of-control
points provide valuable information about the process.
The control charts are designed to detect shifts with a minimal chance of a
false alarm. That is, there is a negligible chance that the process has not changed
Figure F.52 Selection criteria for control charts.