
Page 414 - Six Sigma Demystified
P. 414
394 Six SigMa DemystifieD
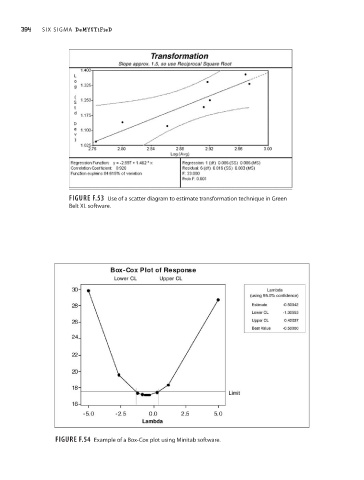
Figure F.53 use of a scatter diagram to estimate transformation technique in green
Belt xL software.
Figure F.54 Example of a Box-Cox plot using Minitab software.