
Page 416 - Six Sigma Demystified
P. 416
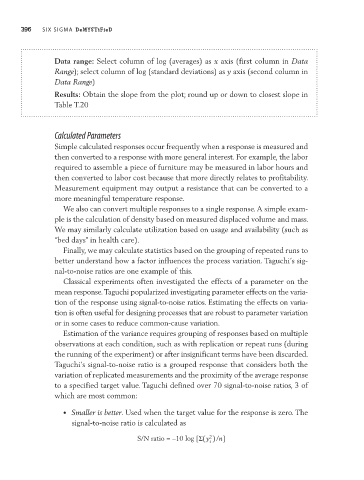
396        Six SigMa  DemystifieD


                        Data range: Select column of log (averages) as x axis (first column in Data
                        Range); select column of log (standard deviations) as y axis (second column in
                        Data Range)
                        Results: Obtain the slope from the plot; round up or down to closest slope in
                        Table T.20


                        Calculated Parameters
                        Simple calculated responses occur frequently when a response is measured and
                        then converted to a response with more general interest. For example, the labor
                        required to assemble a piece of furniture may be measured in labor hours and
                        then converted to labor cost because that more directly relates to profitability.
                        Measurement equipment may output a resistance that can be converted to a
                        more meaningful temperature response.
                          We also can convert multiple responses to a single response. A simple exam-
                        ple is the calculation of density based on measured displaced volume and mass.
                        We may similarly calculate utilization based on usage and availability (such as
                        “bed days” in health care).
                          Finally, we may calculate statistics based on the grouping of repeated runs to
                        better understand how a factor influences the process variation. Taguchi’s sig-
                        nal-to-noise ratios are one example of this.
                          Classical experiments often investigated the effects of a parameter on the
                        mean response. Taguchi popularized investigating parameter effects on the varia-
                        tion of the response using signal-to-noise ratios. Estimating the effects on varia-
                        tion is often useful for designing processes that are robust to parameter variation

                        or in some cases to reduce common-cause variation.
                          Estimation of the variance requires grouping of responses based on multiple
                        observations at each condition, such as with replication or repeat runs (during
                        the running of the experiment) or after insignificant terms have been discarded.
                        Taguchi’s signal-to-noise ratio is a grouped response that considers both the
                        variation of replicated measurements and the proximity of the average response
                        to a specified target value. Taguchi defined over 70 signal-to-noise ratios, 3 of
                        which are most common:
                          •  Smaller is better. Used when the target value for the response is zero. The
                             signal-to-noise ratio is calculated as

                                                                   2
                                               S/N ratio = –10 log [Σ(y )/n]
                                                                   i