
Page 412 - Six Sigma Demystified
P. 412
392 Six SigMa DemystifieD
when a special cause has been identified. Conversely, there is overwhelming
evidence that the process has changed, and by removing this special cause, we
will reduce the overall variability of the process. Therefore, whenever a special
cause is present, we must not ignore it but learn from it.
When we encounter special causes of variation, we must determine (in pro-
cess terms) the cause of the process shift. For example, if the control chart
indicates that service times are now below the lower control limit, indicating
that they were improved, the cause might be that we had changed the method
of customer service by routing clients to more experienced personnel.
Once we have identified the special cause, we can statistically recalculate the
control chart’s centerlines and control limits without including the data known
to be affected by the special cause. If the process shift is sustained, such as when
a new procedure replaces old process procedures, then we simply calculate new
control limits for the new, improved process.
As discussed earlier, when the process is in control, subgroups have only an
extremely small chance of being outside the control limits. If we incorrectly say
that the process has shifted, then we have committed a false alarm. The chance
of a false alarm in most control charts is about 1 in 370: For every 370 sub-
groups plotted, on average, 1 subgroup would be falsely estimated to be out of
control. Since we often experience real changes to our process in less time that
that, this is considered to be appropriately insignificant.
We start the process of variation reduction by isolating the instances of
variation owing to special causes. We can use the time-ordered nature of the
control chart to understand what happened (in process terms) at each point
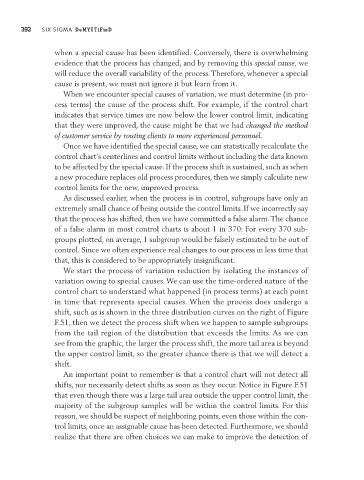
in time that represents special causes. When the process does undergo a
shift, such as is shown in the three distribution curves on the right of Figure
F.51, then we detect the process shift when we happen to sample subgroups
from the tail region of the distribution that exceeds the limits. As we can
see from the graphic, the larger the process shift, the more tail area is beyond
the upper control limit, so the greater chance there is that we will detect a
shift.
An important point to remember is that a control chart will not detect all
shifts, nor necessarily detect shifts as soon as they occur. Notice in Figure F.51
that even though there was a large tail area outside the upper control limit, the
majority of the subgroup samples will be within the control limits. For this
reason, we should be suspect of neighboring points, even those within the con-
trol limits, once an assignable cause has been detected. Furthermore, we should
realize that there are often choices we can make to improve the detection of