
Page 409 - Six Sigma Demystified
P. 409
Part 3 S i x S i g m a To o l S 389
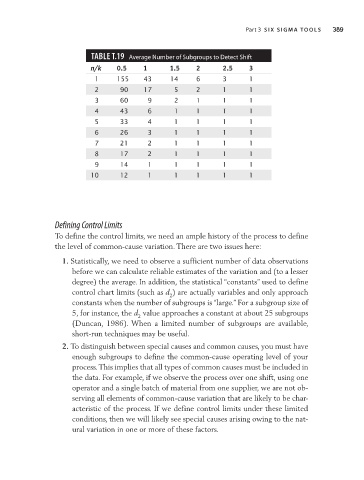
TAbLe T.19 average Number of Subgroups to Detect Shift
n/k 0.5 1 1.5 2 2.5 3
1 155 43 14 6 3 1
2 90 17 5 2 1 1
3 60 9 2 1 1 1
4 43 6 1 1 1 1
5 33 4 1 1 1 1
6 26 3 1 1 1 1
7 21 2 1 1 1 1
8 17 2 1 1 1 1
9 14 1 1 1 1 1
10 12 1 1 1 1 1
Defining Control Limits
To define the control limits, we need an ample history of the process to define
the level of common-cause variation. There are two issues here:
1. Statistically, we need to observe a sufficient number of data observations
before we can calculate reliable estimates of the variation and (to a lesser
degree) the average. In addition, the statistical “constants” used to define
control chart limits (such as d ) are actually variables and only approach
2
constants when the number of subgroups is “large.” For a subgroup size of
5, for instance, the d value approaches a constant at about 25 subgroups
2
(Duncan, 1986). When a limited number of subgroups are available,
short-run techniques may be useful.
2. To distinguish between special causes and common causes, you must have
enough subgroups to define the common-cause operating level of your
process. This implies that all types of common causes must be included in
the data. For example, if we observe the process over one shift, using one
operator and a single batch of material from one supplier, we are not ob-
serving all elements of common-cause variation that are likely to be char-
acteristic of the process. If we define control limits under these limited
conditions, then we will likely see special causes arising owing to the nat-
ural variation in one or more of these factors.