
Page 388 - Six Sigma Demystified
P. 388
368 Six SigMa DemystifieD
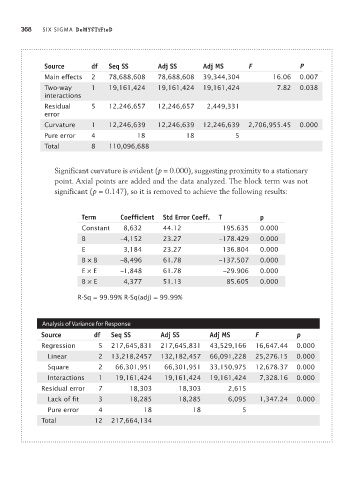
Source df Seq SS Adj SS Adj MS F P
Main effects 2 78,688,608 78,688,608 39,344,304 16.06 0.007
Two-way 1 19,161,424 19,161,424 19,161,424 7.82 0.038
interactions
Residual 5 12,246,657 12,246,657 2,449,331
error
Curvature 1 12,246,639 12,246,639 12,246,639 2,706,955.45 0.000
Pure error 4 18 18 5
Total 8 110,096,688
Significant curvature is evident (p = 0.000), suggesting proximity to a stationary
point. Axial points are added and the data analyzed. The block term was not
significant (p = 0.147), so it is removed to achieve the following results:
Term Coefficient Std Error Coeff. T p
Constant 8,632 44.12 195.635 0.000
B –4,152 23.27 –178.429 0.000
E 3,184 23.27 136.804 0.000
B × B –8,496 61.78 –137.507 0.000
E × E –1,848 61.78 –29.906 0.000
B × E 4,377 51.13 85.605 0.000
R-Sq = 99.99% R-Sq(adj) = 99.99%
analysis of Variance for Response
Source df Seq SS Adj SS Adj MS F p
Regression 5 217,645,831 217,645,831 43,529,166 16,647.44 0.000
Linear 2 13,218,2457 132,182,457 66,091,228 25,276.15 0.000
Square 2 66,301,951 66,301,951 33,150,975 12,678.37 0.000
Interactions 1 19,161,424 19,161,424 19,161,424 7,328.16 0.000
Residual error 7 18,303 18,303 2,615
Lack of fit 3 18,285 18,285 6,095 1,347.24 0.000
Pure error 4 18 18 5
Total 12 217,664,134