Page 385 - Six Sigma Demystified
P. 385
Part 3  S i x   S i g m a  To o l S        365


                                = 1: Equal importance on target and bound (linear).
                                >1 (max = 10): High emphasis on target; must be very close to
                                target for desirability.


                                      Response Surface Designs


                           Note:  This example is a continuation of the example presented under “Factorial
                             Designs” above.

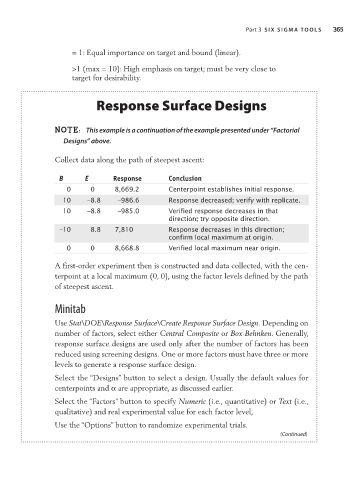
                           Collect data along the path of steepest ascent:


                            B      E       Response        Conclusion
                              0      0      8,669.2        Centerpoint	establishes	initial	response.
                             10     –8.8    –986.6         Response	decreased;	verify	with	replicate.
                             10     –8.8    –985.0         Verified	response	decreases	in	that
                                                           direction;	try	opposite	direction.
                            –10      8.8    7,810          Response	decreases	in	this	direction;
                                                           confirm	local	maximum	at	origin.
                              0      0      8,668.8        Verified	local	maximum	near	origin.

                           A first-order experiment then is constructed and data collected, with the cen-
                           terpoint at a local maximum (0, 0), using the factor levels defined by the path
                           of steepest ascent.


                           Minitab

                           Use Stat\DOE\Response Surface\Create Response Surface Design. Depending on
                           number of factors, select either Central Composite or Box-Behnken. Generally,
                           response surface designs are used only after the number of factors has been
                           reduced using screening designs. One or more factors must have three or more
                           levels to generate a response surface design.
                           Select the “Designs” button to select a design. Usually the default values for
                           centerpoints and α are appropriate, as discussed earlier.
                           Select the “Factors” button to specify Numeric (i.e., quantitative) or Text (i.e.,
                           qualitative) and real experimental value for each factor level,

                           Use the “Options” button to randomize experimental trials.
                                                                                          (Continued)

