
Page 422 - Six Sigma Demystified
P. 422
402 Six SigMa DemystifieD
• Calculate the measured distance from the previous process step location
to this process step’s location.
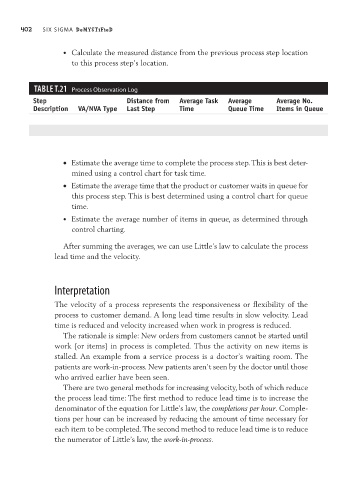
TAbLe T.21 Process Observation Log
Step Distance from Average Task Average Average No.
Description VA/NVA Type Last Step Time Queue Time Items in Queue
• Estimate the average time to complete the process step. This is best deter-
mined using a control chart for task time.
• Estimate the average time that the product or customer waits in queue for
this process step. This is best determined using a control chart for queue
time.
• Estimate the average number of items in queue, as determined through
control charting.
After summing the averages, we can use Little’s law to calculate the process
lead time and the velocity.
Interpretation
The velocity of a process represents the responsiveness or flexibility of the
process to customer demand. A long lead time results in slow velocity. Lead
time is reduced and velocity increased when work in progress is reduced.
The rationale is simple: New orders from customers cannot be started until
work (or items) in process is completed. Thus the activity on new items is
stalled. An example from a service process is a doctor’s waiting room. The
patients are work-in-process. New patients aren’t seen by the doctor until those
who arrived earlier have been seen.
There are two general methods for increasing velocity, both of which reduce
the process lead time: The first method to reduce lead time is to increase the
denominator of the equation for Little’s law, the completions per hour. Comple-
tions per hour can be increased by reducing the amount of time necessary for
each item to be completed. The second method to reduce lead time is to reduce
the numerator of Little’s law, the work-in-process.