
Page 427 - Six Sigma Demystified
P. 427
Part 3 S i x S i g m a To o l S 407
The sensitivity of X-bar charts to process shifts can be improved with the
proper selection of subgroup size. The larger the subgroup, the more sensi-
tive the chart will be to shifts, provided that a rational subgroup can be
formed.
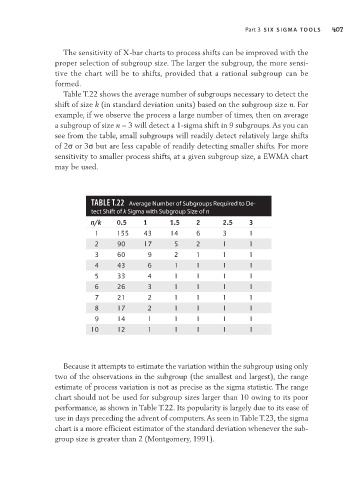
Table T.22 shows the average number of subgroups necessary to detect the
shift of size k (in standard deviation units) based on the subgroup size n. For
example, if we observe the process a large number of times, then on average
a subgroup of size n = 3 will detect a 1-sigma shift in 9 subgroups. As you can
see from the table, small subgroups will readily detect relatively large shifts
of 2σ or 3σ but are less capable of readily detecting smaller shifts. For more
sensitivity to smaller process shifts, at a given subgroup size, a EWMA chart
may be used.
TAbLe T.22 average Number of Subgroups Required to De-
tect Shift of k Sigma with Subgroup Size of n
n/k 0.5 1 1.5 2 2.5 3
1 155 43 14 6 3 1
2 90 17 5 2 1 1
3 60 9 2 1 1 1
4 43 6 1 1 1 1
5 33 4 1 1 1 1
6 26 3 1 1 1 1
7 21 2 1 1 1 1
8 17 2 1 1 1 1
9 14 1 1 1 1 1
10 12 1 1 1 1 1
Because it attempts to estimate the variation within the subgroup using only
two of the observations in the subgroup (the smallest and largest), the range
estimate of process variation is not as precise as the sigma statistic. The range
chart should not be used for subgroup sizes larger than 10 owing to its poor
performance, as shown in Table T.22. Its popularity is largely due to its ease of
use in days preceding the advent of computers. As seen in Table T.23, the sigma
chart is a more efficient estimator of the standard deviation whenever the sub-
group size is greater than 2 (Montgomery, 1991).