
Page 428 - Six Sigma Demystified
P. 428
408 Six SigMa DemystifieD
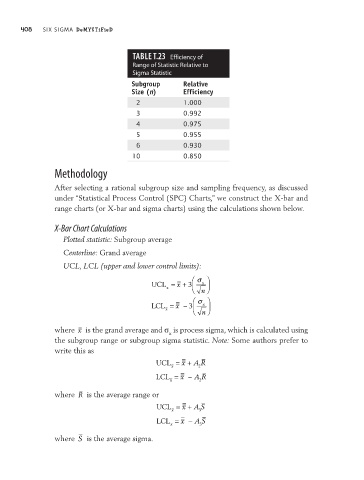
TAbLe T.23 Efficiency of
Range of Statistic Relative to
Sigma Statistic
Subgroup Relative
Size (n) Efficiency
2 1.000
3 0.992
4 0.975
5 0.955
6 0.930
10 0.850
Methodology
After selecting a rational subgroup size and sampling frequency, as discussed
under “Statistical Process Control (SPC) Charts,” we construct the X-bar and
range charts (or X-bar and sigma charts) using the calculations shown below.
X-Bar Chart Calculations
Plotted statistic: Subgroup average
Centerline: Grand average
UCL, LCL (upper and lower control limits):
σ
UCL = x + 3 x
x n
σ
LCL = x − 3 x
x n
where x is the grand average and σ is process sigma, which is calculated using
x
the subgroup range or subgroup sigma statistic. Note: Some authors prefer to
write this as
UCL = x + A R
x
2
LCL = x − A R
x 2
where R is the average range or
UCL = x + A S
x 3
LCL = x − A S
x 3
where S is the average sigma.