
Page 429 - Six Sigma Demystified
P. 429
Part 3 S i x S i g m a To o l S 409
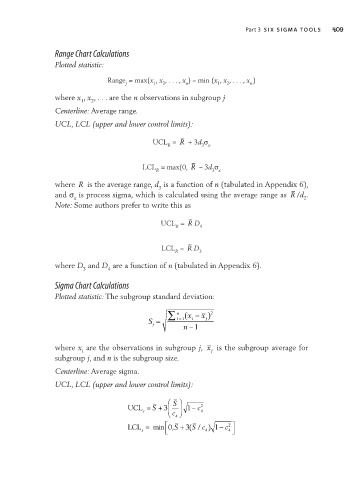
Range Chart Calculations
Plotted statistic:
Range = max(x , x , . . . , x ) – min (x , x , . . . , x )
n
2
j
1
1
n
2
where x , x , . . . are the n observations in subgroup j
1 2
Centerline: Average range.
UCL, LCL (upper and lower control limits):
UCL = R + 3d σ
R 3 x
LCL = max(0, R – 3d σ
R 3 x
where R is the average range, d is a function of n (tabulated in Appendix 6),
3
and σ is process sigma, which is calculated using the average range as R /d .
x 2
Note: Some authors prefer to write this as
UCL = R D 4
R
LCL = R D 3
R
where D and D are a function of n (tabulated in Appendix 6).
3 4
Sigma Chart Calculations
Plotted statistic: The subgroup standard deviation:
∑ n ( x − x ) 2
i
S = i =1 n − 1 j
j
where x are the observations in subgroup j, x is the subgroup average for
i
j
subgroup j, and n is the subgroup size.
Centerline: Average sigma.
UCL, LCL (upper and lower control limits):
S
UCL = S + 3 c 1 − c 2 4
s
4
LCL = min 0, S + 3( / 4 1 − c 2
S c )
s
4