
Page 102 - Six Sigma for electronics design and manufacturing
P. 102
71
Six Sigma and Manufacturing Control Systems
the occurrence of events (failures) follows the statistical laws of the
distribution from which the sample was taken.
Control charts are run charts with a centerline drawn at the manu-
facturing process average and control limit lines drawn at the tail of
the distribution at the 3 s points. They are derived from the distribu-
tion of sample averages X , where s is the standard deviation of the
production samples taken and is related to the population deviation
through the central limit theorem. If the manufacturing process is un-
der statistical control, 99.73% of all observations are within the con-
trol limits of the process. Control charts by themselves do not improve
quality; they merely indicate that the quality is in statistical “syn-
chronization” with the quality level at the time when the charts were
created.
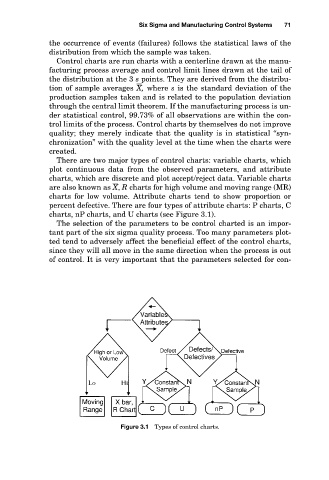
There are two major types of control charts: variable charts, which
plot continuous data from the observed parameters, and attribute
charts, which are discrete and plot accept/reject data. Variable charts
are also known as X , R charts for high volume and moving range (MR)
charts for low volume. Attribute charts tend to show proportion or
percent defective. There are four types of attribute charts: P charts, C
charts, nP charts, and U charts (see Figure 3.1).
The selection of the parameters to be control charted is an impor-
tant part of the six sigma quality process. Too many parameters plot-
ted tend to adversely affect the beneficial effect of the control charts,
since they will all move in the same direction when the process is out
of control. It is very important that the parameters selected for con-
Figure 3.1 Types of control charts.