Page 106 - Six Sigma for electronics design and manufacturing
P. 106

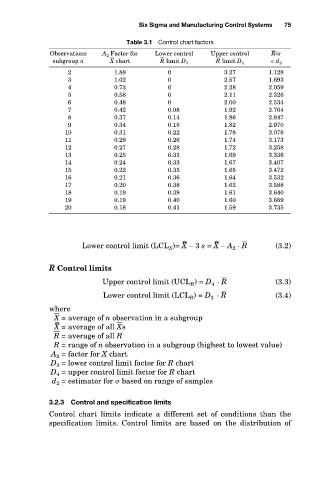
Table 3.1 Control chart factors
                        Observations
                                                              Upper control
                                                 Lower control
                                                                             R  /
                        subgroup n
                                      X   chart
                                                                R   limit D 4
                                                  R   limit D 3
                                                                             = d 2
                                                    0
                                       1.88
                                                                  3.27
                                                    0
                                       1.02
                                                                  2.57
                                                                            1.693
                                       0.73
                                                                  2.28
                                                                            2.059
                                                    0
                                                                  2.11
                                                    0
                                       0.58
                                                                            2.326
                                                    0
                                       0.48
                                                                            2.534
                                                                  2.00
                                                                  1.92
                                                    0.08
                                       0.42
                                                                            2.704
                                       0.37
                                                                            2.847
                                                    0.14
                                                                  1.86
                            9 2 3 4 5 6 7 8  A 2 Factor for  Six Sigma and Manufacturing Control Systems 1.128 75
                                                                            2.970
                                                                  1.82
                                                    0.18
                                       0.34
                           10          0.31         0.22          1.78      3.078
                           11          0.29         0.26          1.74      3.173
                           12          0.27         0.28          1.72      3.258
                           13          0.25         0.31          1.69      3.336
                           14          0.24         0.33          1.67      3.407
                           15          0.22         0.35          1.65      3.472
                           16          0.21         0.36          1.64      3.532
                           17          0.20         0.38          1.62      3.588
                           18          0.19         0.39          1.61      3.640
                           19          0.19         0.40          1.60      3.689
                           20          0.18         0.41          1.59      3.735
                                                        – –    – –
                                Lower control limit (LCL X )= X – 3 s = X – A 2 · R    (3.2)
                        R   Control limits
                                    Upper control limit (UCL R ) = D 4 · R    (3.3)
                                     Lower control limit (LCL R ) = D 3 · R    (3.4)
                        where
                         X   = average of n observation in a subgroup
                         – –
                         X = average of all X  s
                         R   = average of all R
                         R = range of n observation in a subgroup (highest to lowest value)
                        A 2 = factor for X chart
                        D 3 = lower control limit factor for R chart
                        D 4 = upper control limit factor for R chart
                        d 2 = estimator for   based on range of samples
                        3.2.3  Control and specification limits
                        Control  chart  limits  indicate  a  different  set  of  conditions  than  the
                        specification  limits.  Control  limits  are  based  on  the  distribution  of
   101   102   103   104   105   106   107   108   109   110   111