
Page 111 - Six Sigma for electronics design and manufacturing
P. 111
Six Sigma for Electronics Design and Manufacturing
80
(the A 2 factor for n = 4 from Table 3.1), resulting in 0.9125. This is
– –
the approximate distance from the X (sometimes called the center-
line or CL) to one of the control limits in the X chart.
3. The frequency of taking samples for control charts is left up to the
manufacturing process quality status controller. For high-quality
processes, a daily sample for each shift is adequate to ensure con-
formance. For production lines with frequent quality problems,
more sampling might be required, depending on the number of parts
being produced or the number of hours since the last sample. This is
necessary if reworking out-of-control parts is required. In this case,
material or parts produced since the last good sample plot on the
chart has to be reworked. In addition, The problem has to be inves-
tigated by production engineers and possible causes recorded on the
chart. The production engineer may require that more frequent
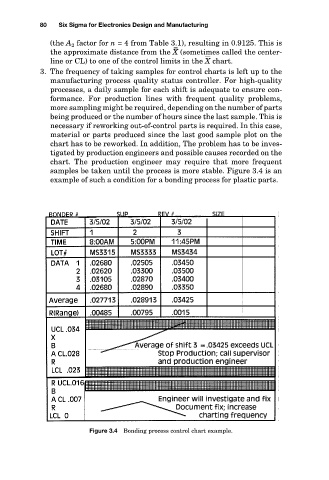
samples be taken until the process is more stable. Figure 3.4 is an
example of such a condition for a bonding process for plastic parts.
Figure 3.4 Bonding process control chart example.