
Page 110 - Six Sigma for electronics design and manufacturing
P. 110
Six Sigma and Manufacturing Control Systems
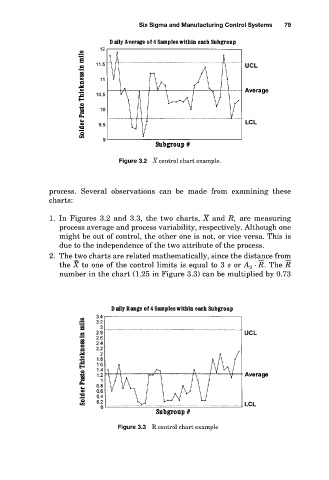
Figure 3.2 X control chart example. 79
process. Several observations can be made from examining these
charts:
1. In Figures 3.2 and 3.3, the two charts, X and R, are measuring
process average and process variability, respectively. Although one
might be out of control, the other one is not, or vice versa. This is
due to the independence of the two attribute of the process.
2. The two charts are related mathematically, since the distance from
– –
the X to one of the control limits is equal to 3 s or A 2 · R . The R
number in the chart (1.25 in Figure 3.3) can be multiplied by 0.73
Figure 3.3 R control chart example