Page 108 - Six Sigma for electronics design and manufacturing
P. 108

Six Sigma and Manufacturing Control Systems
                                            Parts
                        Sample
                                                                Average
                                                                   X
                                 1
                                                         4
                                         2
                                                 3
                                                                            R
                        no.
                                                                             5
                                                        14
                                                 11
                                                                  11.50
                                         12
                                                 12
                                         16
                                                                  12.50
                                                                             7
                                                         9
                                 11
                                         11
                                                                             2
                                                         9
                                                                  10.25
                                                 10
                                                                  12.25
                                                        12
                                                                             3
                                         11
                                                 12
                                 14
                                                                  14.00
                                 12
                                                 16
                                                        14
                                         14
                                                                             4
                                                        15
                                         10
                                 19
                                                 13
                                                                  14.25
                                                                             9
                                                                             4
                        7 1 2 3 4 5 6  13 9  Table 3.2 Control chart limit calculations example  Range  77
                                                        13
                                                                  12.50
                                                 10
                                         14
                                 13
                        8        18      11      14     11        13.50      7
                        9        13      13      11     12        12.25      2
                        10       12      10      14     12        12.00      4
                        11       13      10      14     17        13.50      7
                        12       13      15      10     10        12.00      5
                        13       16      10      10     11        11.75      6
                        14       15      15      13     14        14.25      2
                        15       16      10      14     15        13.75      6
                        16       12      11      14      9        11.50      5
                        17       14      10      13     11        12.00      4
                        18       11      16      13     14        13.50      5
                        19       12      10      12     13        11.75      3
                        20       13      10      10     11        11.00      3
                        21       14      14      10     13        12.75      4
                        22       13      13       9     10        11.25      4
                        23       13      13      13     17        14.00      4
                        24       15      12      15     13        13.75      3
                        25       15      12      15     13        13.75      3
                        Totals                                   315.50    111
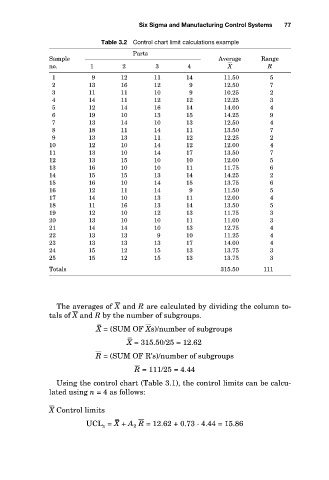
                         The averages of X   and R are calculated by dividing the column to-
                        tals of X   and R by the number of subgroups.
                                   – –
                                   X = (SUM OF X  s)/number of subgroups
                                           – –
                                          X = 315.50/25 = 12.62
                                   R   = (SUM OF R’s)/number of subgroups
                                            R   = 111/25 = 4.44
                         Using the control chart (Table 3.1), the control limits can be calcu-
                        lated using n = 4 as follows:
                        X   Control limits
                                       – –
                                 UCL x = X + A 2 R   = 12.62 + 0.73 · 4.44 = 15.86
   103   104   105   106   107   108   109   110   111   112   113