
Page 113 - Six Sigma for electronics design and manufacturing
P. 113
Six Sigma for Electronics Design and Manufacturing
82
cators of out-of-control conditions can be used as well. These indi-
cators have a probability approaching that of the one X point out-
side the control limits, whose probability is equal to 0.00135. Each
half of the X chart can be divided into three segments, being one
standard deviation (s) wide. The probability of an X point occurring
outside the 2 s limit or beyond is f(–2) = 0.0228, and the probability
of X point occurring outside the 1 s limit is f(–1) = 0.1587 from the
standard normal distribution or z table (Table 2.3).
The probability of multiple X points occurring in succession might
equal that of the one point outside the 3 s limits. For example, two
successive points in the zone beyond 2 s (the outer one-third zone in
the upper half of the chart) is 0.0228 · 0.0228 or 0.00052. A combina-
tion of points inside and outside the zones can be used. For this zone,
two out three X points can be used. The probability of the third point
is 1 – 0.0228 = 0.9772. Since this point can occur anywhere within the
sequence, the total probability has to be multiplied by 3 or 0.0228 ·
0.0228 · 0.9772 · 3 = 0.00152, which is comparable with the 0.00135
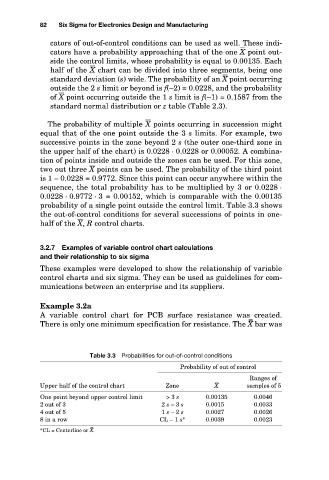
probability of a single point outside the control limit. Table 3.3 shows
the out-of-control conditions for several successions of points in one-
half of the X , R control charts.
3.2.7 Examples of variable control chart calculations
and their relationship to six sigma
These examples were developed to show the relationship of variable
control charts and six sigma. They can be used as guidelines for com-
munications between an enterprise and its suppliers.
Example 3.2a
A variable control chart for PCB surface resistance was created.
– –
There is only one minimum specification for resistance. The X bar was
Table 3.3 Probabilities for out-of-control conditions
Probability of out of control
Ranges of
Upper half of the control chart Zone X samples of 5
One point beyond upper control limit > 3 s 0.00135 0.0046
2 out of 3 2 s – 3 s 0.0015 0.0033
4 out of 5 1 s – 2 s 0.0027 0.0026
8 in a row CL – 1 s* 0.0039 0.0023
– –
*CL = Centerline or X.