
Page 116 - Six Sigma for electronics design and manufacturing
P. 116
Six Sigma and Manufacturing Control Systems
teristic as in variable processes. They are more common in manufac-
turing because of the following:
1. Attribute or pass–fail test data are easier to measure than actual
variable measurement. They can be obtained by devices or tools such
as go/no-go gauges, calibrated for only the specification measure-
ments, as opposed to measuring the full operating spectrum of parts.
2. Attribute data require much less operator training, since they only
have to observe a reject indicator or light, as opposed to making
several measurements on gauges or test equipment. 85
3. Attribute data can be directly collected from the manufacturing
equipment, especially if there is a high degree of automation.
4. Storage and dissemination of attribute data is also much easier,
since there is only the reject rate to store versus the actual meas-
urements for variable data.
Attribute charts use different probability distributions than the
normal distribution used in variable charts, depending on whether
the sample size is constant or changing, as shown in Figure 3.1. For C
and U charts, the Poisson distribution is used, whereas the P and nP
charts use the binomial distribution.
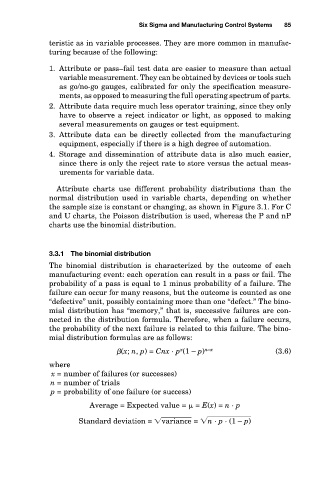
3.3.1 The binomial distribution
The binomial distribution is characterized by the outcome of each
manufacturing event: each operation can result in a pass or fail. The
probability of a pass is equal to 1 minus probability of a failure. The
failure can occur for many reasons, but the outcome is counted as one
“defective” unit, possibly containing more than one “defect.” The bino-
mial distribution has “memory,” that is, successive failures are con-
nected in the distribution formula. Therefore, when a failure occurs,
the probability of the next failure is related to this failure. The bino-
mial distribution formulas are as follows:
x
(x; n, p) = Cnx · p (1 – p) n–x (3.6)
where
x = number of failures (or successes)
n = number of trials
p = probability of one failure (or success)
Average = Expected value = = E(x) = n·p
Standard deviation = v a ri a n ce = n · p · ( 1 – p )