
Page 112 - Six Sigma for electronics design and manufacturing
P. 112
Six Sigma and Manufacturing Control Systems
4. The control limits should not be recalculated unless there is a
change in the manufacturing process. Examples could be new ma-
terials, machinery, operators, or process improvement projects.
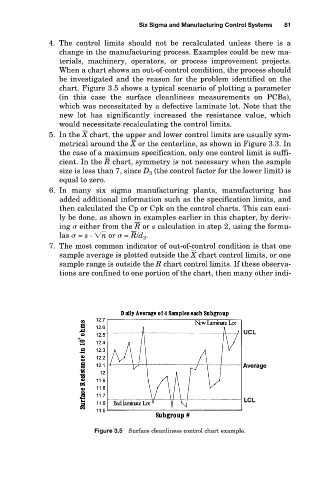
When a chart shows an out-of-control condition, the process should
be investigated and the reason for the problem identified on the
chart. Figure 3.5 shows a typical scenario of plotting a parameter
(in this case the surface cleanliness measurements on PCBs),
which was necessitated by a defective laminate lot. Note that the
new lot has significantly increased the resistance value, which
would necessitate recalculating the control limits. 81
5. In the X chart, the upper and lower control limits are usually sym-
– –
metrical around the X or the centerline, as shown in Figure 3.3. In
the case of a maximum specification, only one control limit is suffi-
cient. In the R chart, symmetry is not necessary when the sample
size is less than 7, since D 3 (the control factor for the lower limit) is
equal to zero.
6. In many six sigma manufacturing plants, manufacturing has
added additional information such as the specification limits, and
then calculated the Cp or Cpk on the control charts. This can easi-
ly be done, as shown in examples earlier in this chapter, by deriv-
ing either from the R or s calculation in step 2, using the formu-
las = s · n or = R /d 2 .
7. The most common indicator of out-of-control condition is that one
sample average is plotted outside the X chart control limits, or one
sample range is outside the R chart control limits. If these observa-
tions are confined to one portion of the chart, then many other indi-
Figure 3.5 Surface cleanliness control chart example.