
Page 146 - Six Sigma for electronics design and manufacturing
P. 146
Determining the Manufacturing Yield and Test Strategy
536
2/21
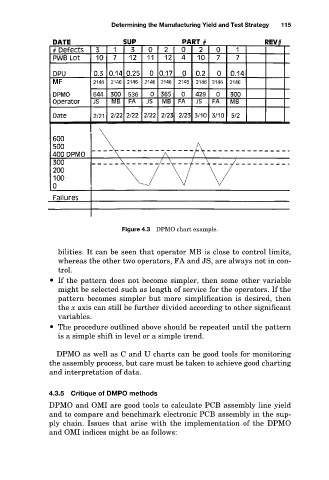
Figure 4.3 DPMO chart example. 115
bilities. It can be seen that operator MB is close to control limits,
whereas the other two operators, FA and JS, are always not in con-
trol.
If the pattern does not become simpler, then some other variable
might be selected such as length of service for the operators. If the
pattern becomes simpler but more simplification is desired, then
the x axis can still be further divided according to other significant
variables.
The procedure outlined above should be repeated until the pattern
is a simple shift in level or a simple trend.
DPMO as well as C and U charts can be good tools for monitoring
the assembly process, but care must be taken to achieve good charting
and interpretation of data.
4.3.5 Critique of DMPO methods
DPMO and OMI are good tools to calculate PCB assembly line yield
and to compare and benchmark electronic PCB assembly in the sup-
ply chain. Issues that arise with the implementation of the DPMO
and OMI indices might be as follows: