
Page 44 - Six Sigma for electronics design and manufacturing
P. 44
The Nature of Six Sigma and Its Connectivity to Other Quality Tools
15
raised to a higher value, noted symbolically in the figure in units of
weight (lbs.).
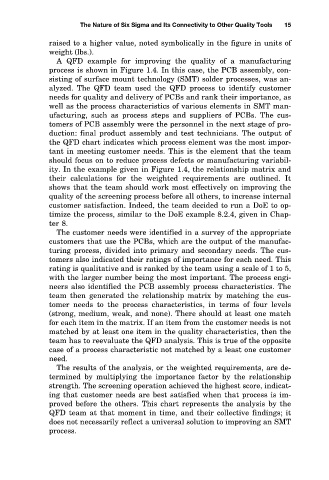
A QFD example for improving the quality of a manufacturing
process is shown in Figure 1.4. In this case, the PCB assembly, con-
sisting of surface mount technology (SMT) solder processes, was an-
alyzed. The QFD team used the QFD process to identify customer
needs for quality and delivery of PCBs and rank their importance, as
well as the process characteristics of various elements in SMT man-
ufacturing, such as process steps and suppliers of PCBs. The cus-
tomers of PCB assembly were the personnel in the next stage of pro-
duction: final product assembly and test technicians. The output of
the QFD chart indicates which process element was the most impor-
tant in meeting customer needs. This is the element that the team
should focus on to reduce process defects or manufacturing variabil-
ity. In the example given in Figure 1.4, the relationship matrix and
their calculations for the weighted requirements are outlined. It
shows that the team should work most effectively on improving the
quality of the screening process before all others, to increase internal
customer satisfaction. Indeed, the team decided to run a DoE to op-
timize the process, similar to the DoE example 8.2.4, given in Chap-
ter 8.
The customer needs were identified in a survey of the appropriate
customers that use the PCBs, which are the output of the manufac-
turing process, divided into primary and secondary needs. The cus-
tomers also indicated their ratings of importance for each need. This
rating is qualitative and is ranked by the team using a scale of 1 to 5,
with the larger number being the most important. The process engi-
neers also identified the PCB assembly process characteristics. The
team then generated the relationship matrix by matching the cus-
tomer needs to the process characteristics, in terms of four levels
(strong, medium, weak, and none). There should at least one match
for each item in the matrix. If an item from the customer needs is not
matched by at least one item in the quality characteristics, then the
team has to reevaluate the QFD analysis. This is true of the opposite
case of a process characteristic not matched by a least one customer
need.
The results of the analysis, or the weighted requirements, are de-
termined by multiplying the importance factor by the relationship
strength. The screening operation achieved the highest score, indicat-
ing that customer needs are best satisfied when that process is im-
proved before the others. This chart represents the analysis by the
QFD team at that moment in time, and their collective findings; it
does not necessarily reflect a universal solution to improving an SMT
process.