
Page 66 - Six Sigma for electronics design and manufacturing
P. 66
The Elements of Six Sigma and Their Determination
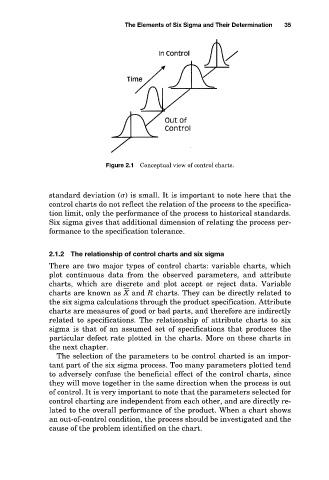
Figure 2.1 Conceptual view of control charts. 35
standard deviation ( ) is small. It is important to note here that the
control charts do not reflect the relation of the process to the specifica-
tion limit, only the performance of the process to historical standards.
Six sigma gives that additional dimension of relating the process per-
formance to the specification tolerance.
2.1.2 The relationship of control charts and six sigma
There are two major types of control charts: variable charts, which
plot continuous data from the observed parameters, and attribute
charts, which are discrete and plot accept or reject data. Variable
charts are known as X and R charts. They can be directly related to
the six sigma calculations through the product specification. Attribute
charts are measures of good or bad parts, and therefore are indirectly
related to specifications. The relationship of attribute charts to six
sigma is that of an assumed set of specifications that produces the
particular defect rate plotted in the charts. More on these charts in
the next chapter.
The selection of the parameters to be control charted is an impor-
tant part of the six sigma process. Too many parameters plotted tend
to adversely confuse the beneficial effect of the control charts, since
they will move together in the same direction when the process is out
of control. It is very important to note that the parameters selected for
control charting are independent from each other, and are directly re-
lated to the overall performance of the product. When a chart shows
an out-of-control condition, the process should be investigated and the
cause of the problem identified on the chart.