
Page 71 - Six Sigma for electronics design and manufacturing
P. 71
Six Sigma for Electronics Design and Manufacturing
40
It has been a historical practice, based on the control charts meth-
odology, to use a natural tolerance of ±3 of the manufacturing
processes as design specification limit criteria. This would result in a
defect rate on both sides of the normal distribution representing the
manufacturing process of 2700 PPM (2 × 1350 PPM for each side) for
processes whose average is equal to the specification nominal. At six
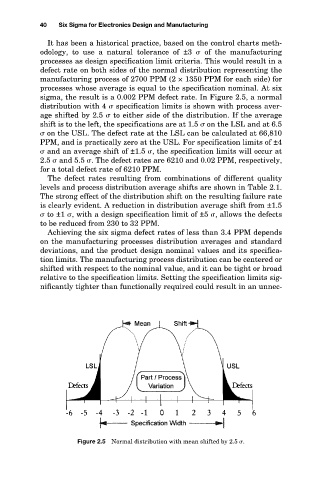
sigma, the result is a 0.002 PPM defect rate. In Figure 2.5, a normal
distribution with 4 specification limits is shown with process aver-
age shifted by 2.5 to either side of the distribution. If the average
shift is to the left, the specifications are at 1.5 on the LSL and at 6.5
on the USL. The defect rate at the LSL can be calculated at 66,810
PPM, and is practically zero at the USL. For specification limits of ±4
and an average shift of ±1.5 , the specification limits will occur at
2.5 and 5.5 . The defect rates are 6210 and 0.02 PPM, respectively,
for a total defect rate of 6210 PPM.
The defect rates resulting from combinations of different quality
levels and process distribution average shifts are shown in Table 2.1.
The strong effect of the distribution shift on the resulting failure rate
is clearly evident. A reduction in distribution average shift from ±1.5
to ±1 , with a design specification limit of ±5 , allows the defects
to be reduced from 230 to 32 PPM.
Achieving the six sigma defect rates of less than 3.4 PPM depends
on the manufacturing processes distribution averages and standard
deviations, and the product design nominal values and its specifica-
tion limits. The manufacturing process distribution can be centered or
shifted with respect to the nominal value, and it can be tight or broad
relative to the specification limits. Setting the specification limits sig-
nificantly tighter than functionally required could result in an unnec-
Figure 2.5 Normal distribution with mean shifted by 2.5 .