
Page 67 - Six Sigma for electronics design and manufacturing
P. 67
Six Sigma for Electronics Design and Manufacturing
36
When introducing control charts to a manufacturing operation, it is
preferred to use parameters that are universally recognized and with
simplified data collection, such as temperature and relative humidity,
or take readings from a process display monitor, such as the tempera-
ture indicator in a soldering system. These initial control charts can
be used to introduce and train the operators in data collection and
plotting of parameters. The same principles in selecting these ele-
ments also apply to six sigma parameter selections.
2.1.3 The process capability index (Cp)
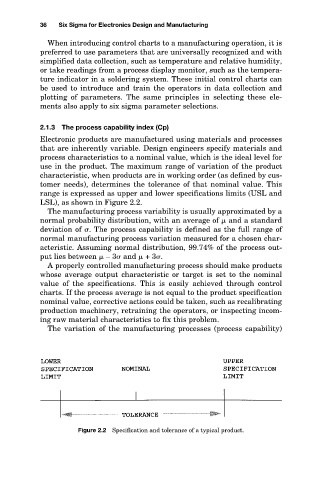
Electronic products are manufactured using materials and processes
that are inherently variable. Design engineers specify materials and
process characteristics to a nominal value, which is the ideal level for
use in the product. The maximum range of variation of the product
characteristic, when products are in working order (as defined by cus-
tomer needs), determines the tolerance of that nominal value. This
range is expressed as upper and lower specifications limits (USL and
LSL), as shown in Figure 2.2.
The manufacturing process variability is usually approximated by a
normal probability distribution, with an average of and a standard
deviation of . The process capability is defined as the full range of
normal manufacturing process variation measured for a chosen char-
acteristic. Assuming normal distribution, 99.74% of the process out-
put lies between – 3 and + 3 .
A properly controlled manufacturing process should make products
whose average output characteristic or target is set to the nominal
value of the specifications. This is easily achieved through control
charts. If the process average is not equal to the product specification
nominal value, corrective actions could be taken, such as recalibrating
production machinery, retraining the operators, or inspecting incom-
ing raw material characteristics to fix this problem.
The variation of the manufacturing processes (process capability)
Figure 2.2 Specification and tolerance of a typical product.