Page 245 - Social Marketing for Public Health Global Trends and Success Stories
P. 245

57977_CH09_final.qxd:Cheng  11/5/09  4:42 PM  Page 218


                218    CHAPTER 9  ■ Creating a Commercial Market for Insecticide-Treated Mosquito Nets


                                 100
                                  90
                                  80
                                  70
                                  60
                                %  50
                                  40
                                  30
                                  20
                                  10
                                   0
                                       1 Lowest      2          3          4       5 Highest

                                                      Commercial  Noncommercial

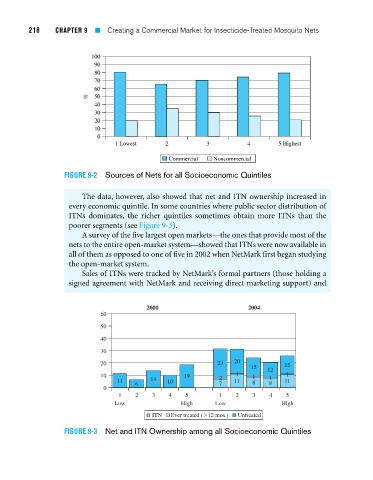
                          FIGURE 9-2 Sources of Nets for all Socioeconomic Quintiles

                              The data, however, also showed that net and ITN ownership increased in
                           every economic quintile. In some countries where public sector distribution of
                           ITNs dominates, the richer quintiles sometimes obtain more ITNs than the
                           poorer segments (see Figure 9-3).
                              A survey of the five largest open markets—the ones that provide most of the
                           nets to the entire open-market system—showed that ITNs were now available in
                           all of them as opposed to one of five in 2002 when NetMark first began studying
                           the open-market system.
                              Sales of ITNs were tracked by NetMark’s formal partners (those holding a
                           signed agreement with NetMark and receiving direct marketing support) and


                                                2000                       2004
                                   60
                                   50
                                   40
                                   30
                                   20                              23  20            15
                                                                            15  12
                                   10                     19       2    1   1    1    1
                                        11   6   14  10            7   11   8    8   11
                                    0
                                        1    2   3    4   5        1    2   3    4    5
                                       Low               High     Low               High
                                                 ITN  Ever treated (.12 mos.)  Untreated

                          FIGURE 9-3 Net and ITN Ownership among all Socioeconomic Quintiles
   240   241   242   243   244   245   246   247   248   249   250