
Page 181 -
P. 181
152 PART TWO MANAGING SOFTWARE PROJECTS
FIGURE 6.3
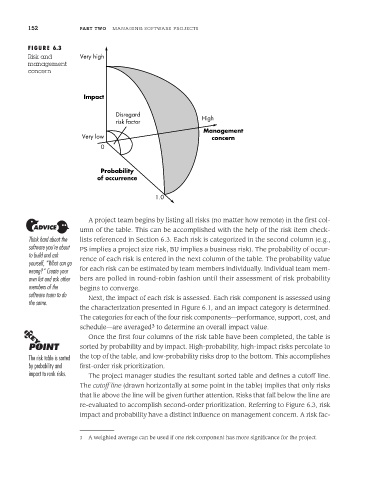
Risk and Very high
management
concern
Impact
Disregard High
risk factor
Management
Very low concern
0
Probability
of occurrence
1.0
A project team begins by listing all risks (no matter how remote) in the first col-
umn of the table. This can be accomplished with the help of the risk item check-
Think hard about the lists referenced in Section 6.3. Each risk is categorized in the second column (e.g.,
software you’re about PS implies a project size risk, BU implies a business risk). The probability of occur-
to build and ask rence of each risk is entered in the next column of the table. The probability value
yourself, “What can go
wrong?” Create your for each risk can be estimated by team members individually. Individual team mem-
own list and ask other bers are polled in round-robin fashion until their assessment of risk probability
members of the begins to converge.
software team to do Next, the impact of each risk is assessed. Each risk component is assessed using
the same.
the characterization presented in Figure 6.1, and an impact category is determined.
The categories for each of the four risk components—performance, support, cost, and
3
schedule—are averaged to determine an overall impact value.
Once the first four columns of the risk table have been completed, the table is
sorted by probability and by impact. High-probability, high-impact risks percolate to
The risk table is sorted the top of the table, and low-probability risks drop to the bottom. This accomplishes
by probability and first-order risk prioritization.
impact to rank risks. The project manager studies the resultant sorted table and defines a cutoff line.
The cutoff line (drawn horizontally at some point in the table) implies that only risks
that lie above the line will be given further attention. Risks that fall below the line are
re-evaluated to accomplish second-order prioritization. Referring to Figure 6.3, risk
impact and probability have a distinct influence on management concern. A risk fac-
3 A weighted average can be used if one risk component has more significance for the project.