
Page 293 -
P. 293
264 PART THREE CONVENTIONAL METHODS FOR SOFTWARE ENGINEERING
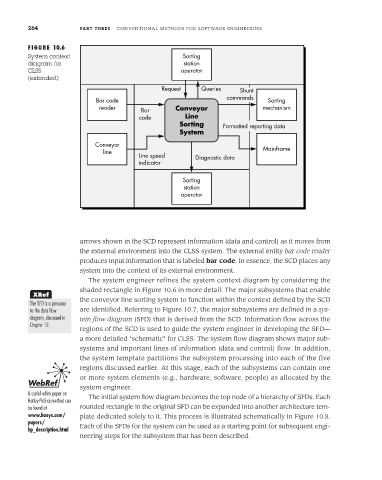
FIGURE 10.6
System context Sorting
diagram for station
CLSS operator
(extended)
Request Queries Shunt
Bar code commands Sorting
reader Conveyor mechanism
Bar
code Line
Sorting Formatted reporting data
System
Conveyor Mainframe
line
Line speed Diagnostic data
indicator
Sorting
station
operator
arrows shown in the SCD represent information (data and control) as it moves from
the external environment into the CLSS system. The external entity bar code reader
produces input information that is labeled bar code. In essence, the SCD places any
system into the context of its external environment.
The system engineer refines the system context diagram by considering the
shaded rectangle in Figure 10.6 in more detail. The major subsystems that enable
XRef
the conveyor line sorting system to function within the context defined by the SCD
The SFD is a precursor
to the data flow are identified. Referring to Figure 10.7, the major subsystems are defined in a sys-
diagram, discussed in tem flow diagram (SFD) that is derived from the SCD. Information flow across the
Chapter 12.
regions of the SCD is used to guide the system engineer in developing the SFD—
a more detailed "schematic" for CLSS. The system flow diagram shows major sub-
systems and important lines of information (data and control) flow. In addition,
the system template partitions the subsystem processing into each of the five
regions discussed earlier. At this stage, each of the subsystems can contain one
or more system elements (e.g., hardware, software, people) as allocated by the
WebRef
system engineer.
A useful white paper on The initial system flow diagram becomes the top node of a hierarchy of SFDs. Each
Hatley-Pirbhai method can
be found at rounded rectangle in the original SFD can be expanded into another architecture tem-
www.hasys.com/ plate dedicated solely to it. This process is illustrated schematically in Figure 10.8.
papers/ Each of the SFDs for the system can be used as a starting point for subsequent engi-
hp_description.html
neering steps for the subsystem that has been described.