
Page 350 -
P. 350
CHAPTER 12 ANALYSIS MODELING 321
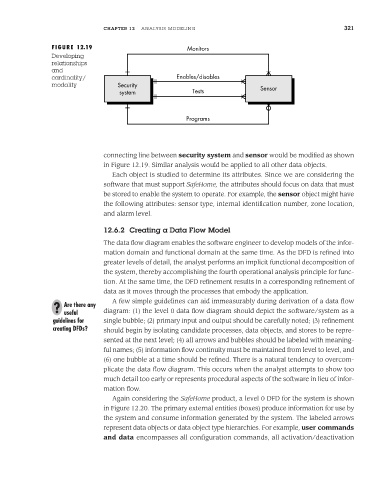
FIGURE 12.19 Monitors
Developing
relationships
and
cardinality/ Enables/disables
modality Security Sensor
system Tests
Programs
connecting line between security system and sensor would be modified as shown
in Figure 12.19. Similar analysis would be applied to all other data objects.
Each object is studied to determine its attributes. Since we are considering the
software that must support SafeHome, the attributes should focus on data that must
be stored to enable the system to operate. For example, the sensor object might have
the following attributes: sensor type, internal identification number, zone location,
and alarm level.
12.6.2 Creating a Data Flow Model
The data flow diagram enables the software engineer to develop models of the infor-
mation domain and functional domain at the same time. As the DFD is refined into
greater levels of detail, the analyst performs an implicit functional decomposition of
the system, thereby accomplishing the fourth operational analysis principle for func-
tion. At the same time, the DFD refinement results in a corresponding refinement of
data as it moves through the processes that embody the application.
A few simple guidelines can aid immeasurably during derivation of a data flow
? Are there any diagram: (1) the level 0 data flow diagram should depict the software/system as a
useful
guidelines for single bubble; (2) primary input and output should be carefully noted; (3) refinement
creating DFDs? should begin by isolating candidate processes, data objects, and stores to be repre-
sented at the next level; (4) all arrows and bubbles should be labeled with meaning-
ful names; (5) information flow continuity must be maintained from level to level, and
(6) one bubble at a time should be refined. There is a natural tendency to overcom-
plicate the data flow diagram. This occurs when the analyst attempts to show too
much detail too early or represents procedural aspects of the software in lieu of infor-
mation flow.
Again considering the SafeHome product, a level 0 DFD for the system is shown
in Figure 12.20. The primary external entities (boxes) produce information for use by
the system and consume information generated by the system. The labeled arrows
represent data objects or data object type hierarchies. For example, user commands
and data encompasses all configuration commands, all activation/deactivation