
Page 347 -
P. 347
318 PART THREE CONVENTIONAL METHODS FOR SOFTWARE ENGINEERING
FIGURE 12.17
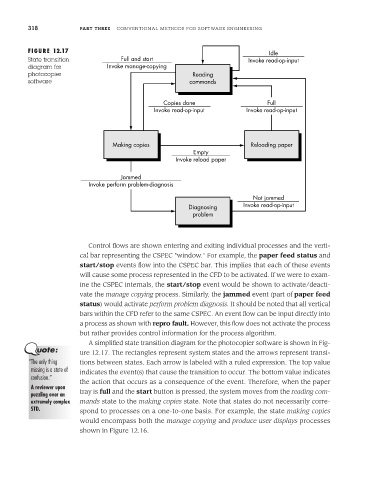
Idle
State transition Full and start Invoke read-op-input
diagram for Invoke manage-copying
photocopier Reading
software commands
Copies done Full
Invoke read-op-input Invoke read-op-input
Making copies Reloading paper
Empty
Invoke reload paper
Jammed
Invoke perform problem-diagnosis
Not jammed
Diagnosing Invoke read-op-input
problem
Control flows are shown entering and exiting individual processes and the verti-
cal bar representing the CSPEC "window." For example, the paper feed status and
start/stop events flow into the CSPEC bar. This implies that each of these events
will cause some process represented in the CFD to be activated. If we were to exam-
ine the CSPEC internals, the start/stop event would be shown to activate/deacti-
vate the manage copying process. Similarly, the jammed event (part of paper feed
status) would activate perform problem diagnosis. It should be noted that all vertical
bars within the CFD refer to the same CSPEC. An event flow can be input directly into
a process as shown with repro fault. However, this flow does not activate the process
but rather provides control information for the process algorithm.
A simplified state transition diagram for the photocopier software is shown in Fig-
ure 12.17. The rectangles represent system states and the arrows represent transi-
“The only thing tions between states. Each arrow is labeled with a ruled expression. The top value
missing is a state of indicates the event(s) that cause the transition to occur. The bottom value indicates
confusion.”
the action that occurs as a consequence of the event. Therefore, when the paper
A reviewer upon
puzzling over an tray is full and the start button is pressed, the system moves from the reading com-
extremely complex mands state to the making copies state. Note that states do not necessarily corre-
STD. spond to processes on a one-to-one basis. For example, the state making copies
would encompass both the manage copying and produce user displays processes
shown in Figure 12.16.