
Page 346 -
P. 346
CHAPTER 12 ANALYSIS MODELING 317
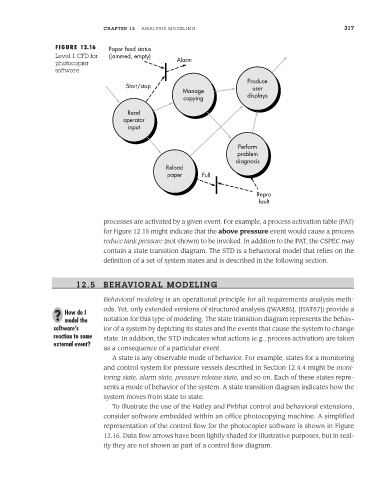
FIGURE 12.16 Paper feed status
Level 1 CFD for (jammed, empty)
photocopier Alarm
software
Produce
Start/stop user
Manage
copying displays
Read
operator
input
Perform
problem
diagnosis
Reload
paper Full
Repro
fault
processes are activated by a given event. For example, a process activation table (PAT)
for Figure 12.15 might indicate that the above pressure event would cause a process
reduce tank pressure (not shown) to be invoked. In addition to the PAT, the CSPEC may
contain a state transition diagram. The STD is a behavioral model that relies on the
definition of a set of system states and is described in the following section.
12.5 BEHAVIORAL MODELING
Behavioral modeling is an operational principle for all requirements analysis meth-
ods. Yet, only extended versions of structured analysis ([WAR85], [HAT87]) provide a
? How do I notation for this type of modeling. The state transition diagram represents the behav-
model the
software’s ior of a system by depicting its states and the events that cause the system to change
reaction to some state. In addition, the STD indicates what actions (e.g., process activation) are taken
external event?
as a consequence of a particular event.
A state is any observable mode of behavior. For example, states for a monitoring
and control system for pressure vessels described in Section 12.4.4 might be moni-
toring state, alarm state, pressure release state, and so on. Each of these states repre-
sents a mode of behavior of the system. A state transition diagram indicates how the
system moves from state to state.
To illustrate the use of the Hatley and Pirbhai control and behavioral extensions,
consider software embedded within an office photocopying machine. A simplified
representation of the control flow for the photocopier software is shown in Figure
12.16. Data flow arrows have been lightly shaded for illustrative purposes, but in real-
ity they are not shown as part of a control flow diagram.