
Page 342 -
P. 342
CHAPTER 12 ANALYSIS MODELING 313
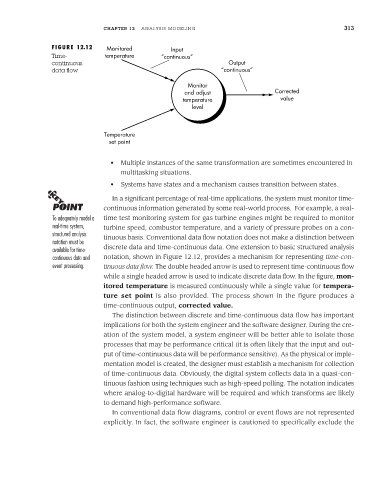
FIGURE 12.12 Monitored Input
Time- temperature “continuous”
continuous Output
data flow “continuous”
Monitor
and adjust Corrected
temperature value
level
Temperature
set point
• Multiple instances of the same transformation are sometimes encountered in
multitasking situations.
• Systems have states and a mechanism causes transition between states.
In a significant percentage of real-time applications, the system must monitor time-
continuous information generated by some real-world process. For example, a real-
To adequately model a time test monitoring system for gas turbine engines might be required to monitor
real-time system, turbine speed, combustor temperature, and a variety of pressure probes on a con-
structured analysis tinuous basis. Conventional data flow notation does not make a distinction between
notation must be
available for time- discrete data and time-continuous data. One extension to basic structured analysis
continuous data and notation, shown in Figure 12.12, provides a mechanism for representing time-con-
event processing. tinuous data flow. The double headed arrow is used to represent time-continuous flow
while a single headed arrow is used to indicate discrete data flow. In the figure, mon-
itored temperature is measured continuously while a single value for tempera-
ture set point is also provided. The process shown in the figure produces a
time-continuous output, corrected value.
The distinction between discrete and time-continuous data flow has important
implications for both the system engineer and the software designer. During the cre-
ation of the system model, a system engineer will be better able to isolate those
processes that may be performance critical (it is often likely that the input and out-
put of time-continuous data will be performance sensitive). As the physical or imple-
mentation model is created, the designer must establish a mechanism for collection
of time-continuous data. Obviously, the digital system collects data in a quasi-con-
tinuous fashion using techniques such as high-speed polling. The notation indicates
where analog-to-digital hardware will be required and which transforms are likely
to demand high-performance software.
In conventional data flow diagrams, control or event flows are not represented
explicitly. In fact, the software engineer is cautioned to specifically exclude the