
Page 340 -
P. 340
CHAPTER 12 ANALYSIS MODELING 311
12.4.1 Data Flow Diagrams
As information moves through software, it is modified by a series of transformations.
A data flow diagram is a graphical representation that depicts information flow and
the transforms that are applied as data move from input to output. The basic form
The DFD provides a
mechanism for of a data flow diagram, also known as a data flow graph or a bubble chart, is illus-
information flow trated in Figure 12.10.
modeling and The data flow diagram may be used to represent a system or software at any level
functional modeling.
of abstraction. In fact, DFDs may be partitioned into levels that represent increasing
information flow and functional detail. Therefore, the DFD provides a mechanism for
functional modeling as well as information flow modeling. In so doing, it satisfies the
second operational analysis principle (i.e., creating a functional model) discussed in
Chapter 11.
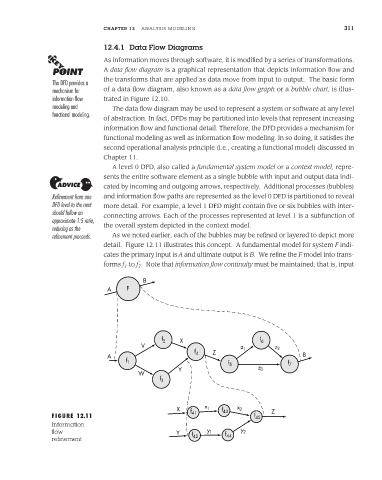
A level 0 DFD, also called a fundamental system model or a context model, repre-
sents the entire software element as a single bubble with input and output data indi-
cated by incoming and outgoing arrows, respectively. Additional processes (bubbles)
Refinement from one and information flow paths are represented as the level 0 DFD is partitioned to reveal
DFD level to the next more detail. For example, a level 1 DFD might contain five or six bubbles with inter-
should follow an connecting arrows. Each of the processes represented at level 1 is a subfunction of
approximate 1:5 ratio,
reducing as the the overall system depicted in the context model.
refinement proceeds. As we noted earlier, each of the bubbles may be refined or layered to depict more
detail. Figure 12.11 illustrates this concept. A fundamental model for system F indi-
cates the primary input is A and ultimate output is B. We refine the F model into trans-
forms f to f . Note that information flow continuity must be maintained; that is, input
1
7
B
A F
f 2 X f 6
V z 1 z 2
f 4 Z
A B
f 1
f 5 f 7
Y z 3
W
f 3
X f 41 x 1 f 43 x 2 Z
FIGURE 12.11 f 45
Information
flow Y y 1 y 2
f 42 f 44
refinement