
Page 125 -
P. 125
6 - PROJECT TIME MANAGEMENT
• Provide evidence to indicate that when the system is built to the specified architecture, it will:
• Support the operational concept;
• Satisfy the requirements—that is, capability, interfaces, level of service, quality attributes, and evolution;
• Be buildable within the budget and schedule in the project plan;
• Generate a viable return on investment; and
• Generate satisfactory outcomes for all of the success-critical stakeholders.
• Resolve all major risks or include them in a risk management plan.
6
6.7.2.9 Retrospectives
Retrospectives are a variant of the performance reviews listed in Section 6.7.2.1 of the PMBOK Guide but they
®
are typically held more frequently than traditional performance reviews—usually after each iteration cycle.
6.7.2.10 Cumulative Flow Diagrams
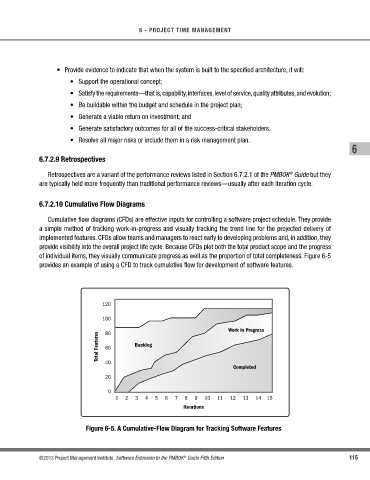
Cumulative flow diagrams (CFDs) are effective inputs for controlling a software project schedule. They provide
a simple method of tracking work-in-progress and visually tracking the trend line for the projected delivery of
implemented features. CFDs allow teams and managers to react early to developing problems and, in addition, they
provide visibility into the overall project life cycle. Because CFDs plot both the total product scope and the progress
of individual items, they visually communicate progress as well as the proportion of total completeness. Figure 6-5
provides an example of using a CFD to track cumulative flow for development of software features.
120
100
Work in Progress
80
Total Features 60 Backlog
40
Completed
20
0
1 2 3 4 5 6 7 8 9 10 11 12 13 14 15
Iterations
Figure 6-5. A Cumulative-Flow Diagram for Tracking Software Features
©2013 Project Management Institute. Software Extension to the PMBOK Guide Fifth Edition 115
®