
Page 126 -
P. 126
6 - PROJECT TIME MANAGEMENT
6.7.2.11 Workflow Board with Daily Walkthrough
A workflow board is a visual depiction of work flowing through a software project when using an on-demand
scheduling approach. Daily walkthroughs provide immediate feedback on blockages and resource issues for the
entire team, effectively supporting decisions.
6.7.2.12 Reprioritization Reviews
Reprioritization reviews are elements of an iterative scheduling process. Lack of satisfactory progress may
require adjustment of priorities among planned work activities.
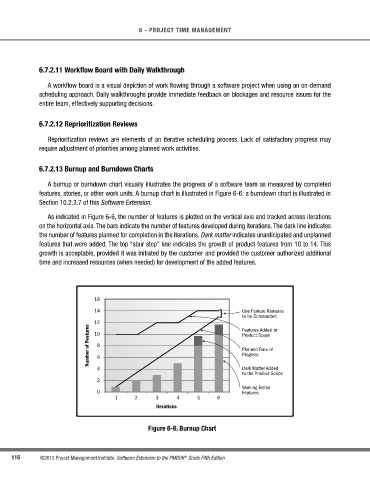
6.7.2.13 Burnup and Burndown Charts
A burnup or burndown chart visually illustrates the progress of a software team as measured by completed
features, stories, or other work units. A burnup chart is illustrated in Figure 6-6; a burndown chart is illustrated in
Section 10.2.3.7 of this Software Extension.
As indicated in Figure 6-6, the number of features is plotted on the vertical axis and tracked across iterations
on the horizontal axis. The bars indicate the number of features developed during iterations. The dark line indicates
the number of features planned for completion in the iterations. Dark matter indicates unanticipated and unplanned
features that were added. The top “stair step” line indicates the growth of product features from 10 to 14. This
growth is acceptable, provided it was initiated by the customer and provided the customer authorized additional
time and increased resources (when needed) for development of the added features.
16
14 } One Feature Remains
to be Constructed
12 Features Added to
Number of Features 8 6 Product Scope
10
Planned Rate of
Progress
4 Dark Matter Added
to the Product Scope
2
Working Tested
0 Features
1 2 3 4 5 6
Iterations
Figure 6-6. Burnup Chart
116 ©2013 Project Management Institute. Software Extension to the PMBOK Guide Fifth Edition
®