
Page 107 - Soil and water contamination, 2nd edition
P. 107
94 Soil and Water Contamination
6642 6642 6642 Residue (mg/l)
< 100
80 80 100 - 1000
1
1000 - 10000
60 60 > 10000
SO4+Cl Ca+Mg
40 40
20 20
10
4
9
3
2 8
20 20
5
80 40 40 80
1
Na+K HCO3
6
60 60 60 60
Mg 8
SO4
40 80 7 80 40
2 5
8
20 10 20
1 10 6
9
4 3
80 60 40 20 20 40 60 80
Ca Cl
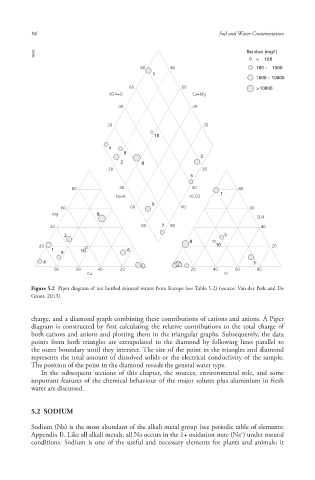
Figure 5.2 Piper diagram of ten bottled mineral waters from Europe (see Table 5.2) (source: Van der Perk and De
Groot, 2013).
charge, and a diamond graph combining these contributions of cations and anions. A Piper
diagram is constructed by first calculating the relative contributions to the total charge of
both cations and anions and plotting them in the triangular graphs. Subsequently, the data
points from both triangles are extrapolated to the diamond by following lines parallel to
the outer boundary until they intersect. The size of the point in the triangles and diamond
represents the total amount of dissolved solids or the electrical conductivity of the sample.
The position of the point in the diamond reveals the general water type.
In the subsequent sections of this chapter, the sources, environmental role, and some
important features of the chemical behaviour of the major solutes plus aluminium in fresh
water are discussed.
5.2 SODIUM
Sodium (Na) is the most abundant of the alkali metal group (see periodic table of elements;
+
Appendix I). Like all alkali metals , all Na occurs in the 1+ oxidation state (Na ) under natural
conditions. Sodium is one of the useful and necessary elements for plants and animals; it
10/1/2013 6:44:24 PM
Soil and Water.indd 106
Soil and Water.indd 106 10/1/2013 6:44:24 PM