
Page 106 - Soil and water contamination, 2nd edition
P. 106
Major dissolved phase constituents 93
provides an opportunity for a first check of the analysis of water composition, by calculating
the charge imbalance using:
IB = (Cations − Anions)/(Cations + Anions) (5.1)
where IB = ionic charge imbalance [−] (usually expressed as percent); Cations and Anions refer
to the respective concentrations of cations and anions expressed in milliequivalents per unit
-1
volume (meq l ). Due to analytical errors in laboratories, ionic charge imbalances of up to
± 2 percent are usual. However, water samples with an absolute charge imbalance greater
than 5 percent are considered to be inaccurate. Note that some ions other than the cations
-
and anions mentioned above may contribute significantly, such as NO in oxic groundwater,
3
+
+
3+
NH in reduced groundwater, or H and Al in acid water. Obviously, if this is the case,
4
these ions should also be considered when calculating the charge imbalance.
The tabulated analysis results are often insufficient for further interpretation of the water
composition of different samples, because it is difficult to obtain an immediate overview over
the data. Therefore, to facilitate the interpretation of water composition, the concentrations
in water are often displayed graphically. Common useful diagrams for the presentation of
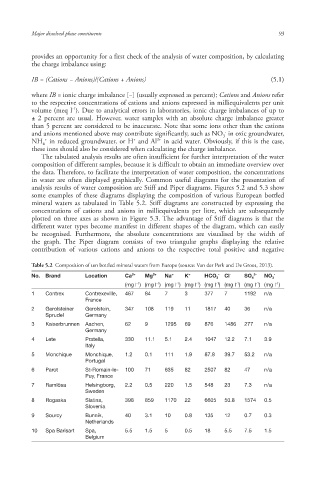
analysis results of water composition are Stiff and Piper diagrams. Figures 5.2 and 5.3 show
some examples of these diagrams displaying the composition of various European bottled
mineral waters as tabulated in Table 5.2. Stiff diagrams are constructed by expressing the
concentrations of cations and anions in milliequivalents per litre, which are subsequently
plotted on three axes as shown in Figure 5.3. The advantage of Stiff diagrams is that the
different water types become manifest in different shapes of the diagram, which can easily
be recognised. Furthermore, the absolute concentrations are visualised by the width of
the graph. The Piper diagram consists of two triangular graphs displaying the relative
contribution of various cations and anions to the respective total positive and negative
Table 5.2 Composition of ten bottled mineral waters from Europe (source: Van der Perk and De Groot, 2013).
No. Brand Location Ca 2+ Mg 2+ Na + K + HCO 3 - Cl - SO 4 2- NO 3 -
-1
-1
-1
-1
-1
-1
-1
-1
(mg l ) (mg l ) (mg l ) (mg l ) (mg l ) (mg l ) (mg l ) (mg l )
1 Contrex Contrexeville, 467 84 7 3 377 7 1192 n/a
France
2 Gerolsteiner Gerolstein, 347 108 119 11 1817 40 36 n/a
Sprudel Germany
3 Kaiserbrunnen Aachen, 62 9 1295 69 876 1486 277 n/a
Germany
4 Lete Pratella, 330 11.1 5.1 2.4 1047 12.2 7.1 3.9
Italy
5 Monchique Monchique, 1.2 0.1 111 1.9 87.8 39.7 53.2 n/a
Portugal
6 Parot St-Romain-le- 100 71 635 82 2507 82 47 n/a
Puy, France
7 Ramlösa Helsingborg, 2.2 0.5 220 1.5 548 23 7.3 n/a
Sweden
8 Rogaska Slatina, 398 859 1170 22 6605 50.8 1574 0.5
Slovenia
9 Sourcy Bunnik, 40 3.1 10 0.8 135 12 0.7 0.3
Netherlands
10 Spa Barisart Spa, 5.5 1.5 5 0.5 18 5.5 7.5 1.5
Belgium
10/1/2013 6:44:24 PM
Soil and Water.indd 105 10/1/2013 6:44:24 PM
Soil and Water.indd 105