
Page 141 - Soil and water contamination, 2nd edition
P. 141
128 Soil and Water Contamination
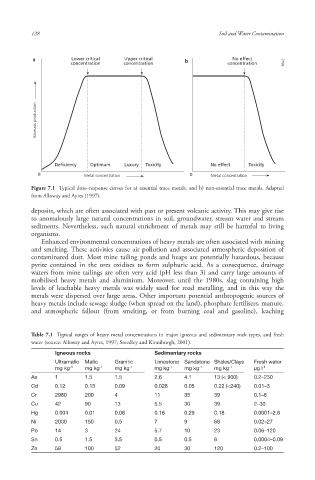
a Lower critical Upper critical b No effect
concentration concentration concentration 6642 6642 6642
Biomass production
Deficiency Optimum Luxury Toxicity No effect Toxicity
0 Metal concentration 0 Metal concentration
Figure 7.1 Typical dose–response curves for a) essential trace metals, and b) non-essential trace metals . Adapted
from Alloway and Ayres (1997).
deposits, which are often associated with past or present volcanic activity. This may give rise
to anomalously large natural concentrations in soil, groundwater, stream water and stream
sediments. Nevertheless, such natural enrichment of metals may still be harmful to living
organisms.
Enhanced environmental concentrations of heavy metals are often associated with mining
and smelting. These activities cause air pollution and associated atmospheric deposition of
contaminated dust. Most mine tailing ponds and heaps are potentially hazardous, because
pyrite contained in the ores oxidises to form sulphuric acid . As a consequence, drainage
waters from mine tailings are often very acid (pH less than 3) and carry large amounts of
mobilised heavy metals and aluminium . Moreover, until the 1980s, slag containing high
levels of leachable heavy metals was widely used for road metalling, and in this way the
metals were dispersed over large areas. Other important potential anthropogenic sources of
heavy metals include sewage sludge (when spread on the land), phosphate fertilisers , manure ,
and atmospheric fallout (from smelting, or from burning coal and gasoline), leaching
Table 7.1 Typical ranges of heavy metal concentrations in major igneous and sedimentary rock types, and fresh
water (source: Alloway and Ayres, 1997; Smedley and Kinniburgh, 2001).
Igneous rocks Sedimentary rocks
Ultramafic Mafic Granitic Limestone Sandstone Shales/Clays Fresh water
mg kg -1 mg kg -1 mg kg -1 mg kg -1 mg kg -1 mg kg -1 µg l -1
As 1 1.5 1.5 2.6 4.1 13 (< 900) 0.2–230
Cd 0.12 0.13 0.09 0.028 0.05 0.22 (<240) 0.01–3
Cr 2980 200 4 11 35 39 0.1–6
Cu 42 90 13 5.5 30 39 2–30
Hg 0.004 0.01 0.08 0.16 0.29 0.18 0.0001–2.8
Ni 2000 150 0.5 7 9 68 0.02–27
Pb 14 3 24 5.7 10 23 0.06–120
Sn 0.5 1.5 3.5 0.5 0.5 6 0.0004–0.09
Zn 58 100 52 20 30 120 0.2–100
10/1/2013 6:44:33 PM
Soil and Water.indd 140 10/1/2013 6:44:33 PM
Soil and Water.indd 140